Pay transparency is a growing movement. Not only are there new laws requiring salary ranges with job postings, but there are also many websites collecting and posting salary survey data for different industries. The architecture industry has had a long standing issue with pay. I wondered, is there a trusted source for Architecture salary data?
Getting architecture salary data
After scouring Indeed, looking at the AIA data, and asking around, I couldn’t find an easy go source of Architecture salary data. Archinect seems to have the current best set of salary data collected through anonymous surveys.
The Archinect salary survey has just under 20k entries dating from 2013. It’s a good enough collection to get a sense. The survey data has a lot of outliers, and I’m not a statistician, so please take my findings with a huge grain of salt.
So… What does the data say about the salary trajectory in Architecture?
To no one’s surprise, a higher title generally means higher pay. median intern pay is around 50k while the median principal pay is 122k. There seems to be two major jumps. One when going from an intern to a junior. The second when one becomes a senior Architect or Principal.
Median Salary by Job Title
The variability increases as titles go up. The interquartile range of intern salaries is 12.5k, while at the principal level, it increases to 47k (IQR is defined as the difference between the 75th and 25th percentile).
Salary Spread by Job Title
Does more experience mean more pay?
Yes! More experience means more pay. It starts slow but jumps quickly at the 6-7 year mark. This seems to correlate with the inflection point when folks get licensed.
Median Salary by Years of Experience. Green indicates Licensed
Are architecture salaries increasing over time?
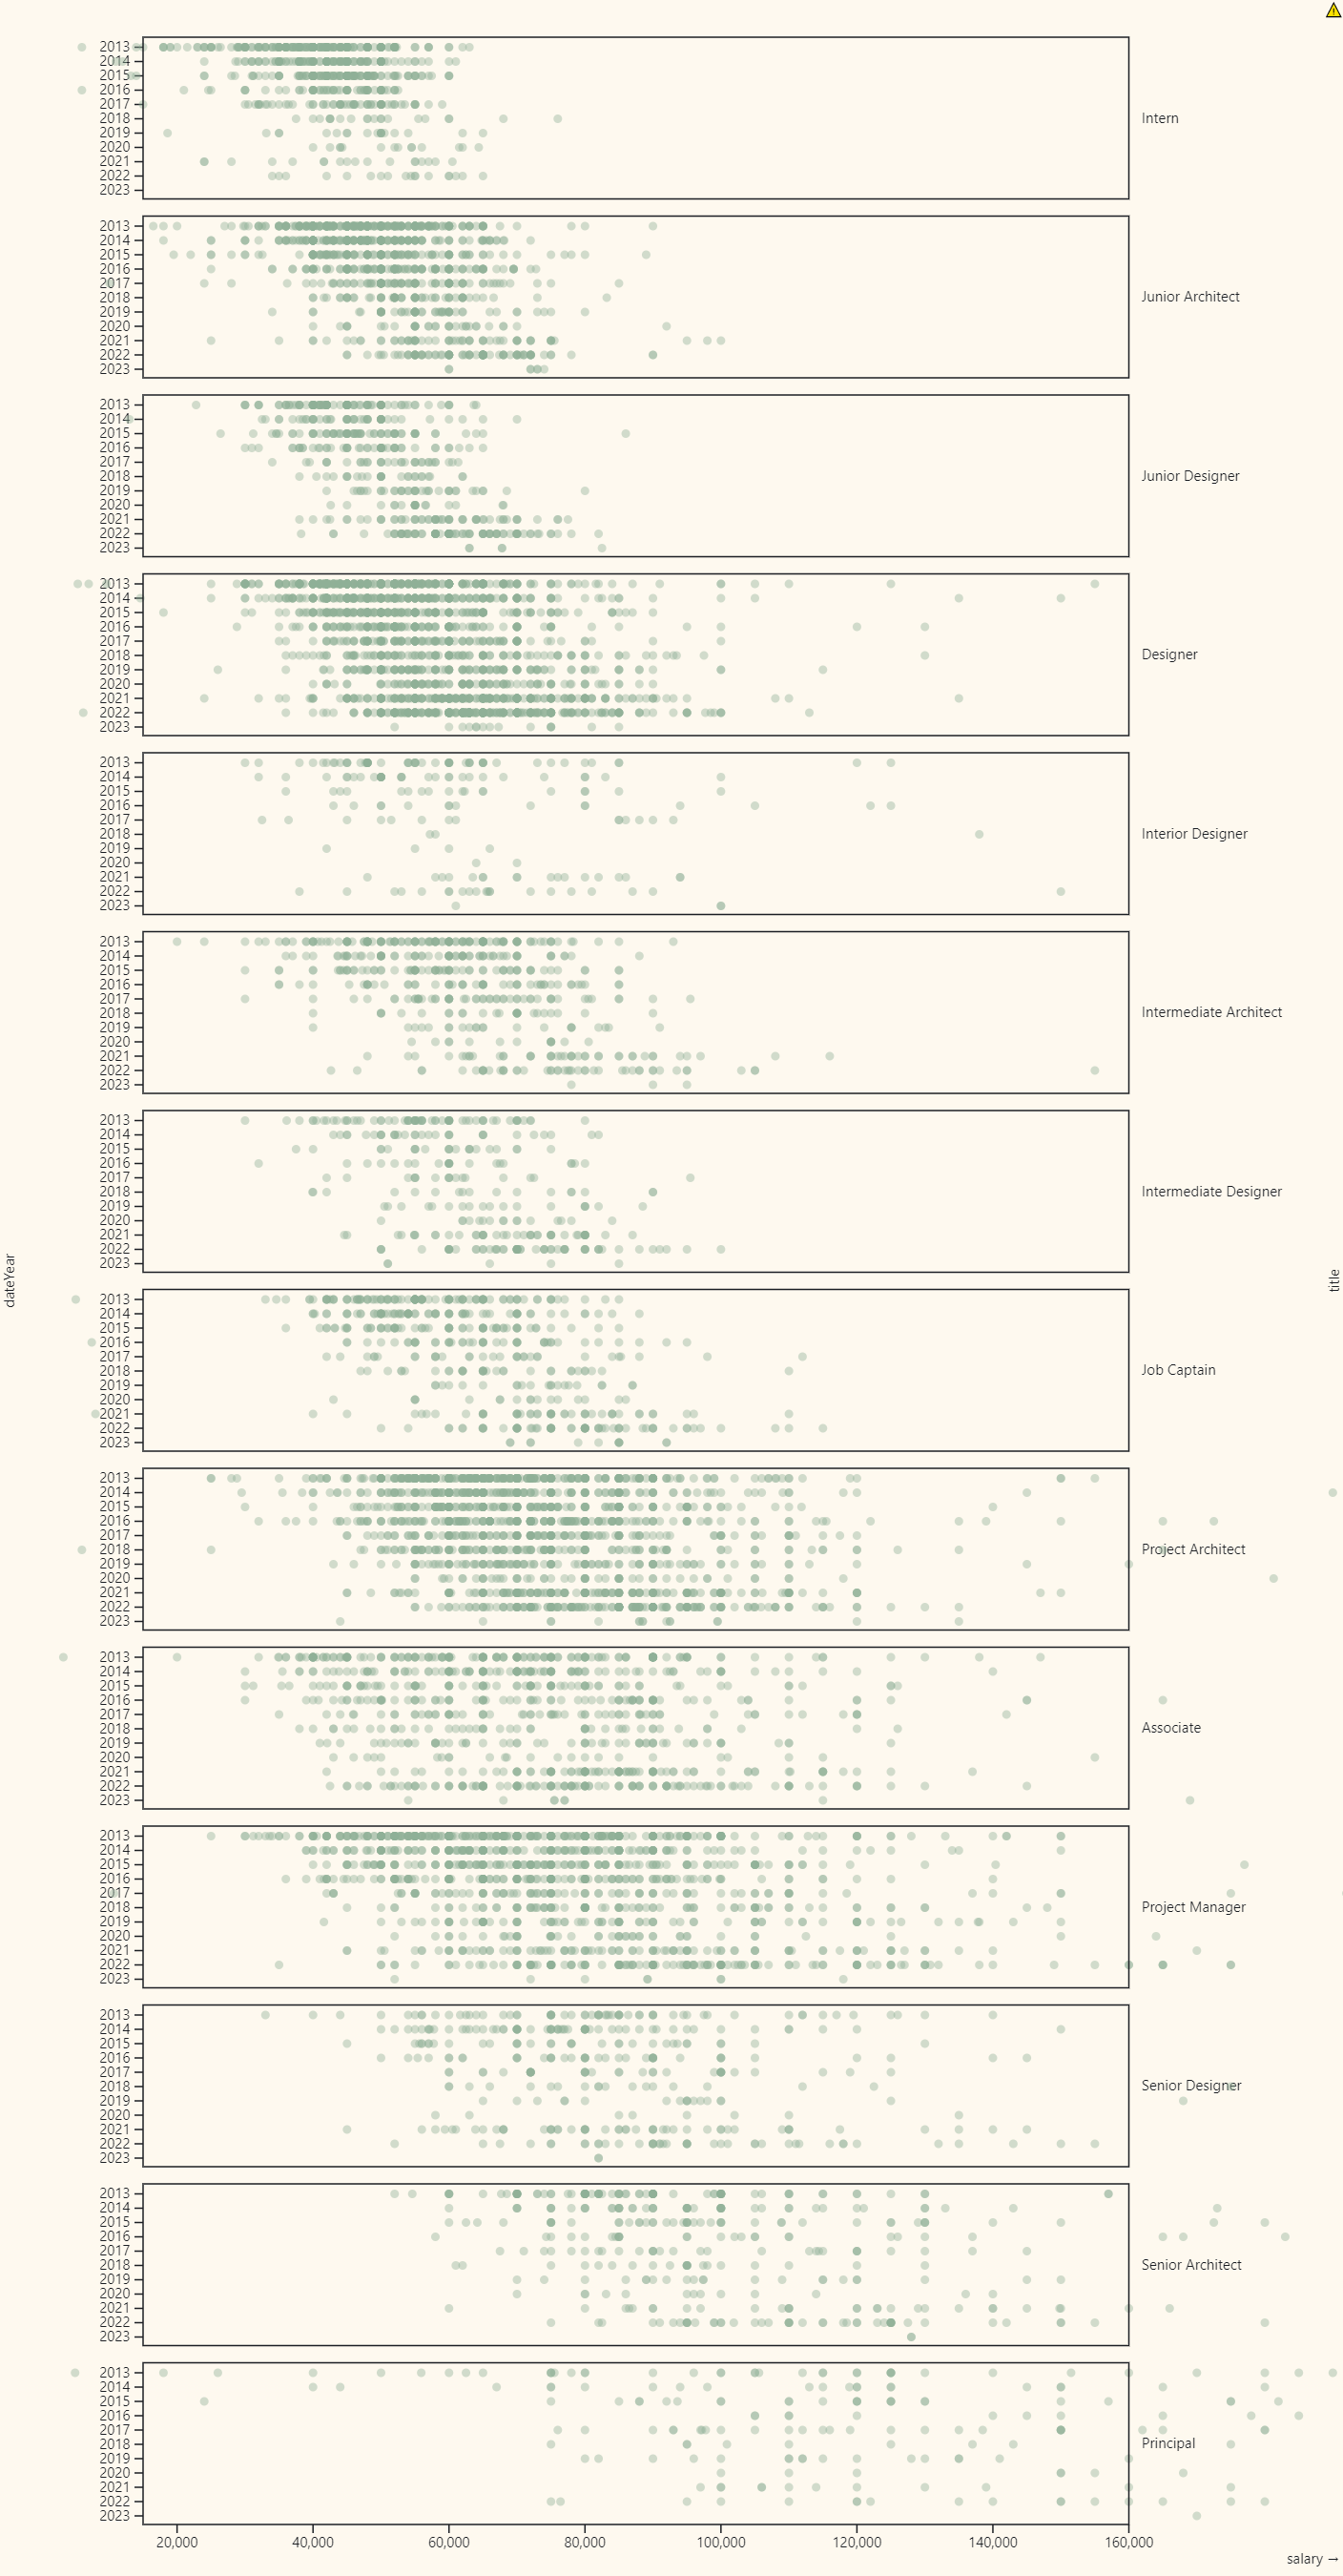
Yes! Looking at the chart, you’ll see the data points move to the right as it goes down. Across all titles, there’s an upward trend year over year.
Salaries by Title by Survey Entry Year
How does Archinect data compare to the AIA data?
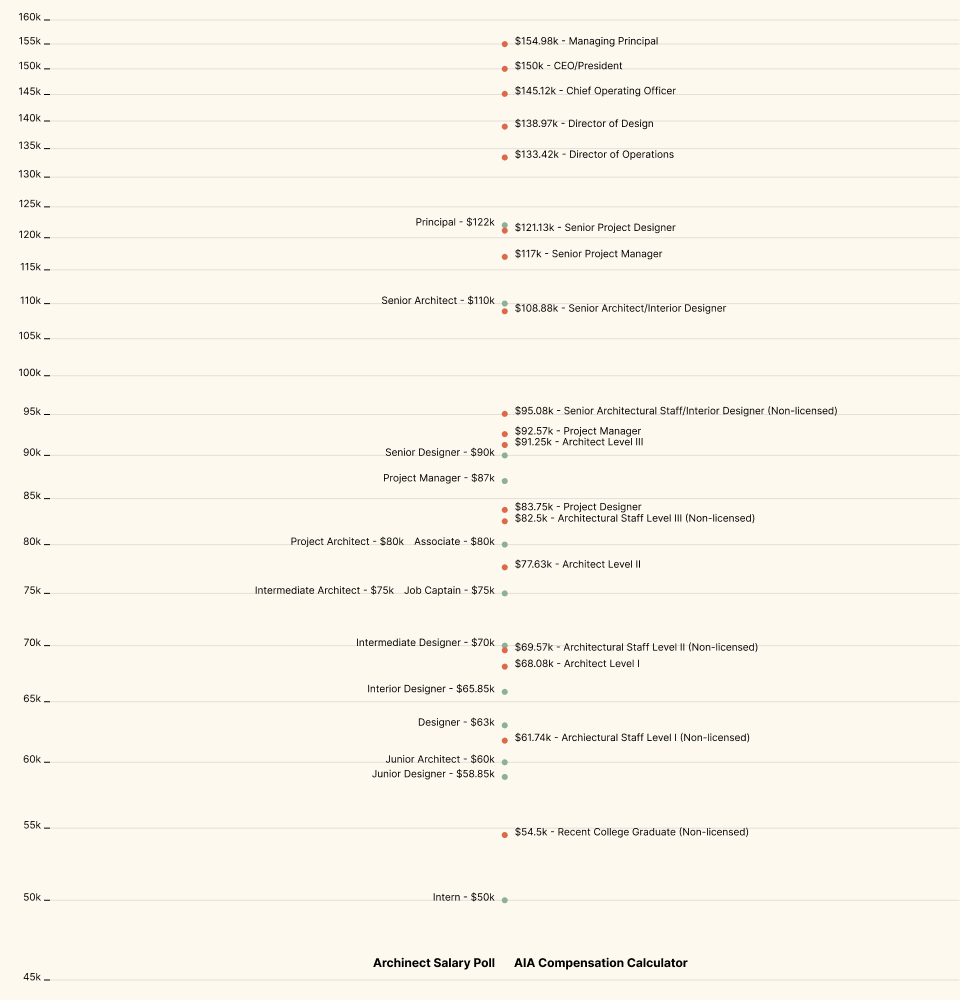
One thing I heard as I asked around is that no one trusts the AIA salary calculator. While the titles are not the same, mapping the Archinect medians to the AIA medians, the results are not that far off. Generally, the AIA numbers are higher, especially at the top end of the scale.
Archinect Salary Poll vs AIA Compensation Calculator
What’s next?
This is just a simple exploration that fulfills my curiosity. To get a more comprehensive look, I probably need more/better data. If this is something that interests you, and you have other questions this dataset could answer, let me know in the comments. You can find the underlying data and how I built these charts here.

